THE SOLUTION
A web tool that turns data into 3D-printable, story-rich globes
A Web App
Drag-and-drop interface where users can upload datasets or grayscale images to map scalar data onto a global field.
3D Model Generator
Automatically translates data fields into mapped geometries on a globe or flat projection, exportable as STL or OBJ.
3D Print + Digital Asset Ready
Models can be used for fabrication or embedded into AR/VR and digital experiences.
WHY IT MATTERS | THE IMPACT
Data You Can Hold
Makes invisible systems visible
Enables deeper understanding of global dynamics like inequality, climate, or history, physically.
Empowers educators, designers, researchers
From classrooms to conferences, this tool bridges data with tangible impact.
First of many lenses
Our Colonial Impact Index is just the beginning. Imagine visualizing CO2 per capita, water scarcity, biodiversity, or internet access, physically and globally.
THE VISION
Imagine a world where datasets become sculptures of meaning.
A universal 3D data globe engine
A modular, generative system for transforming any global dataset into tangible, meaningful form.
Democratizing data physicalization
A tool where anyone can upload their dataset and create something printable, visual, and visceral.
From fields to futures
To reimagine data not just as information, but as form, bridging science, art, and storytelling.
THE WHY
Global data is too complex to stay two-dimensional.
-
Flat maps flatten meaning
Traditional visualizations can't fully capture the complexity, relationships, and weight of global data across space and time.
-
We learn better through touch
Physicalization of data creates deeper emotional, cognitive, and educational impact, especially for underrepresented or abstract datasets.
-
There's no open tool for this
Designers, researchers, and educators currently lack an easy, accessible way to turn global datasets into 3D printable, manipulatable world models.
OUR PROCESS
From raw data to physical form

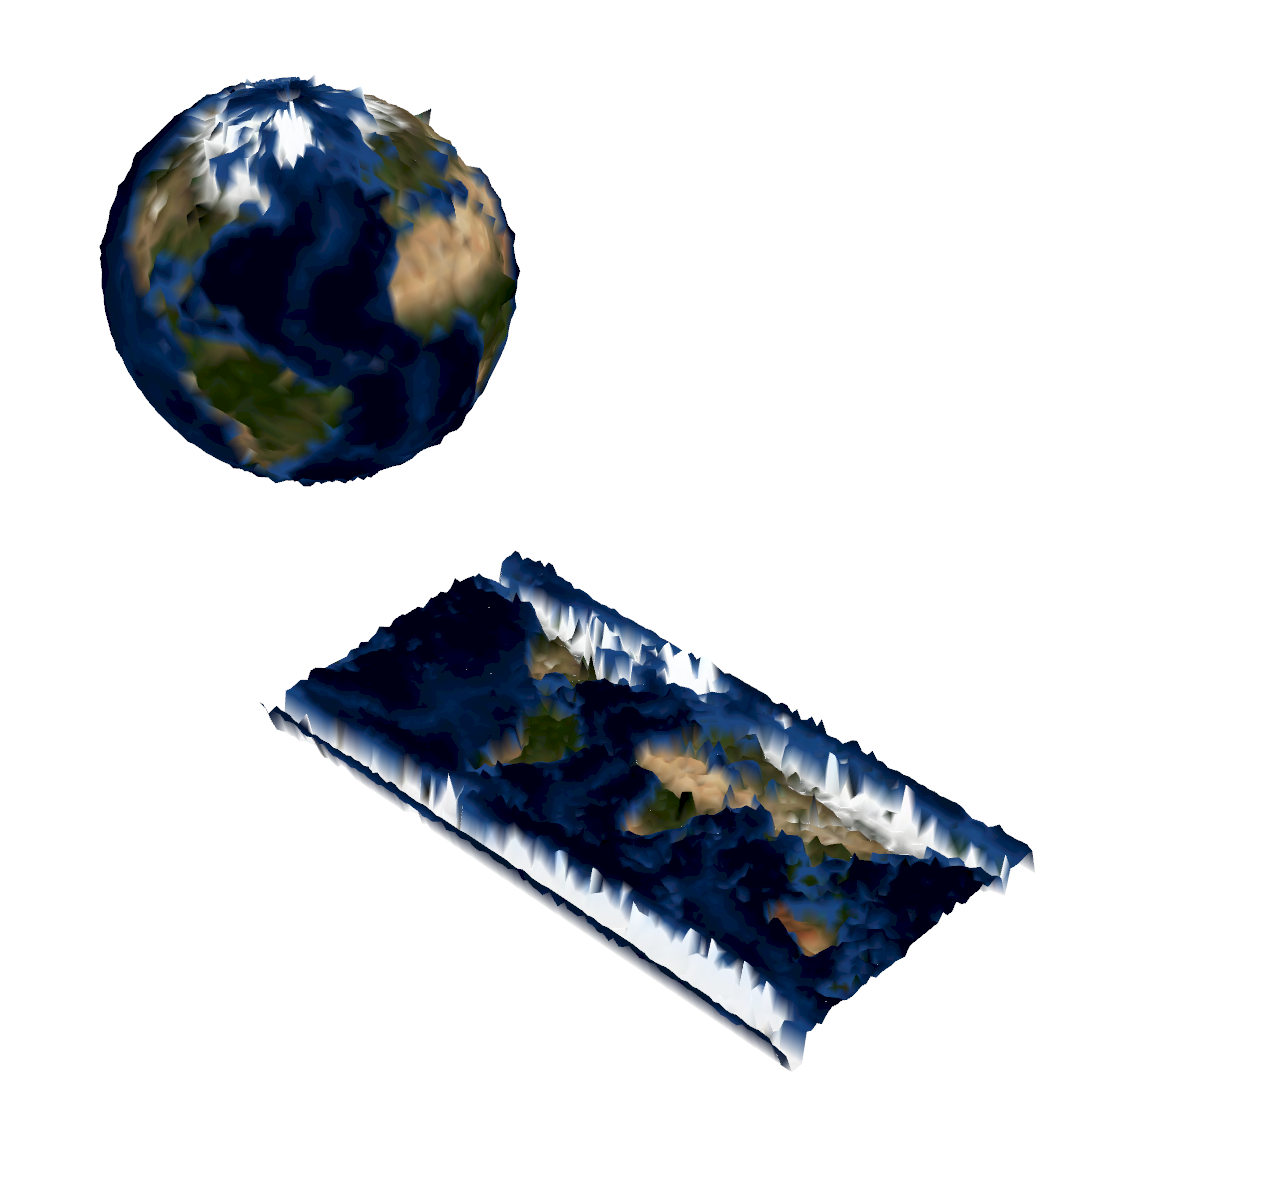
Topography
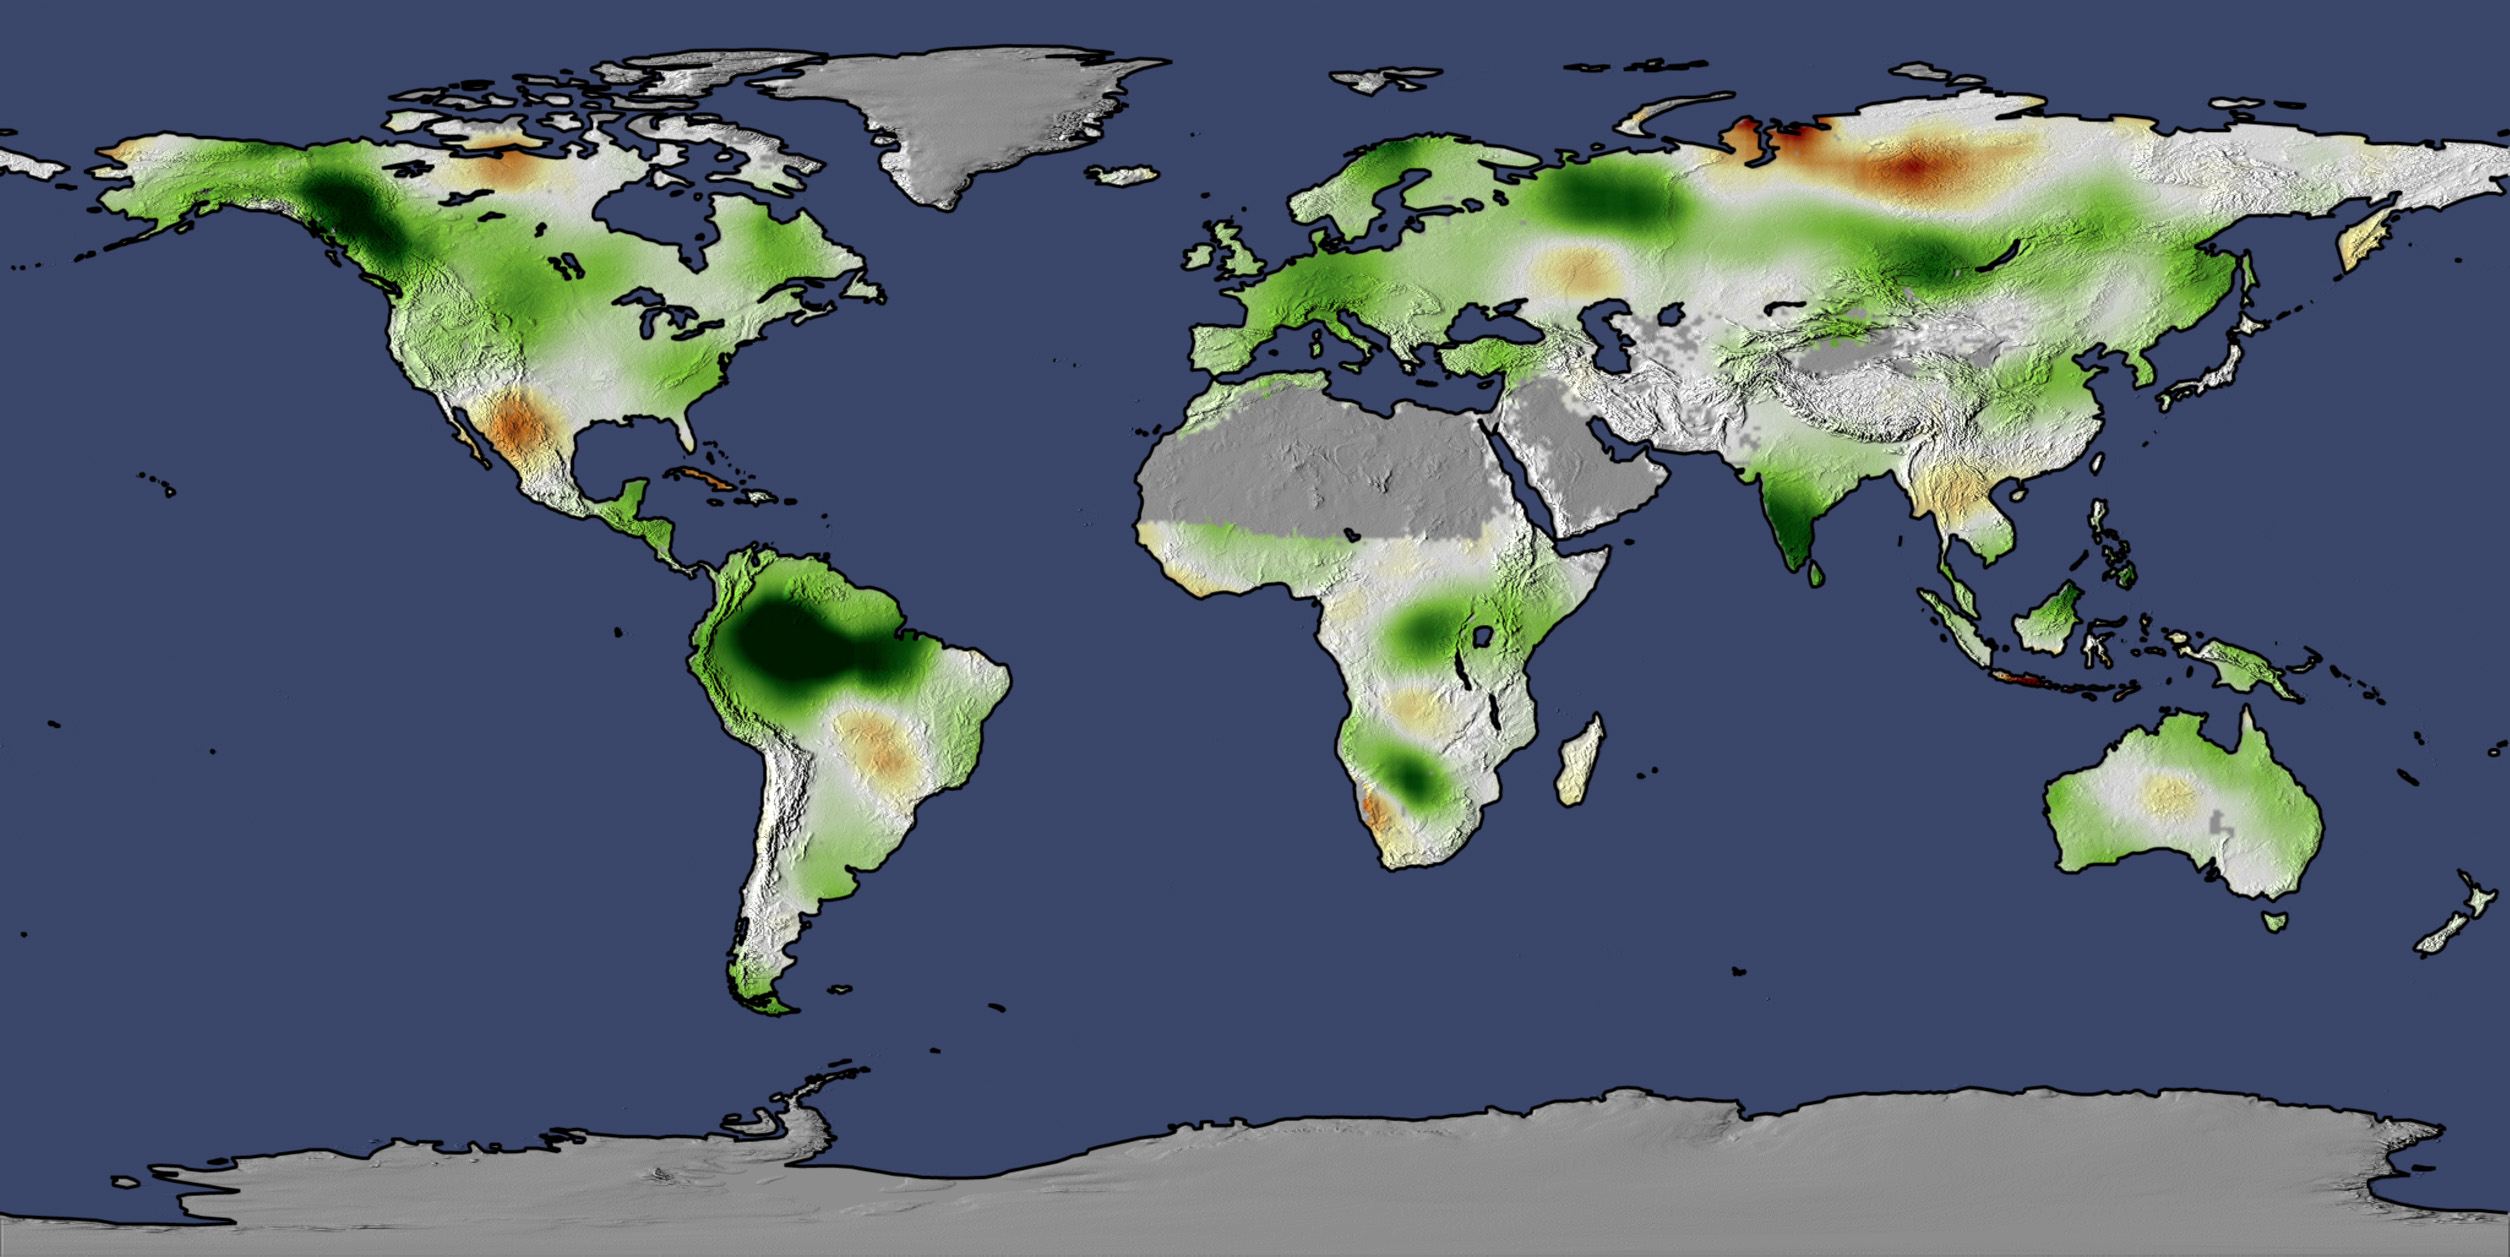
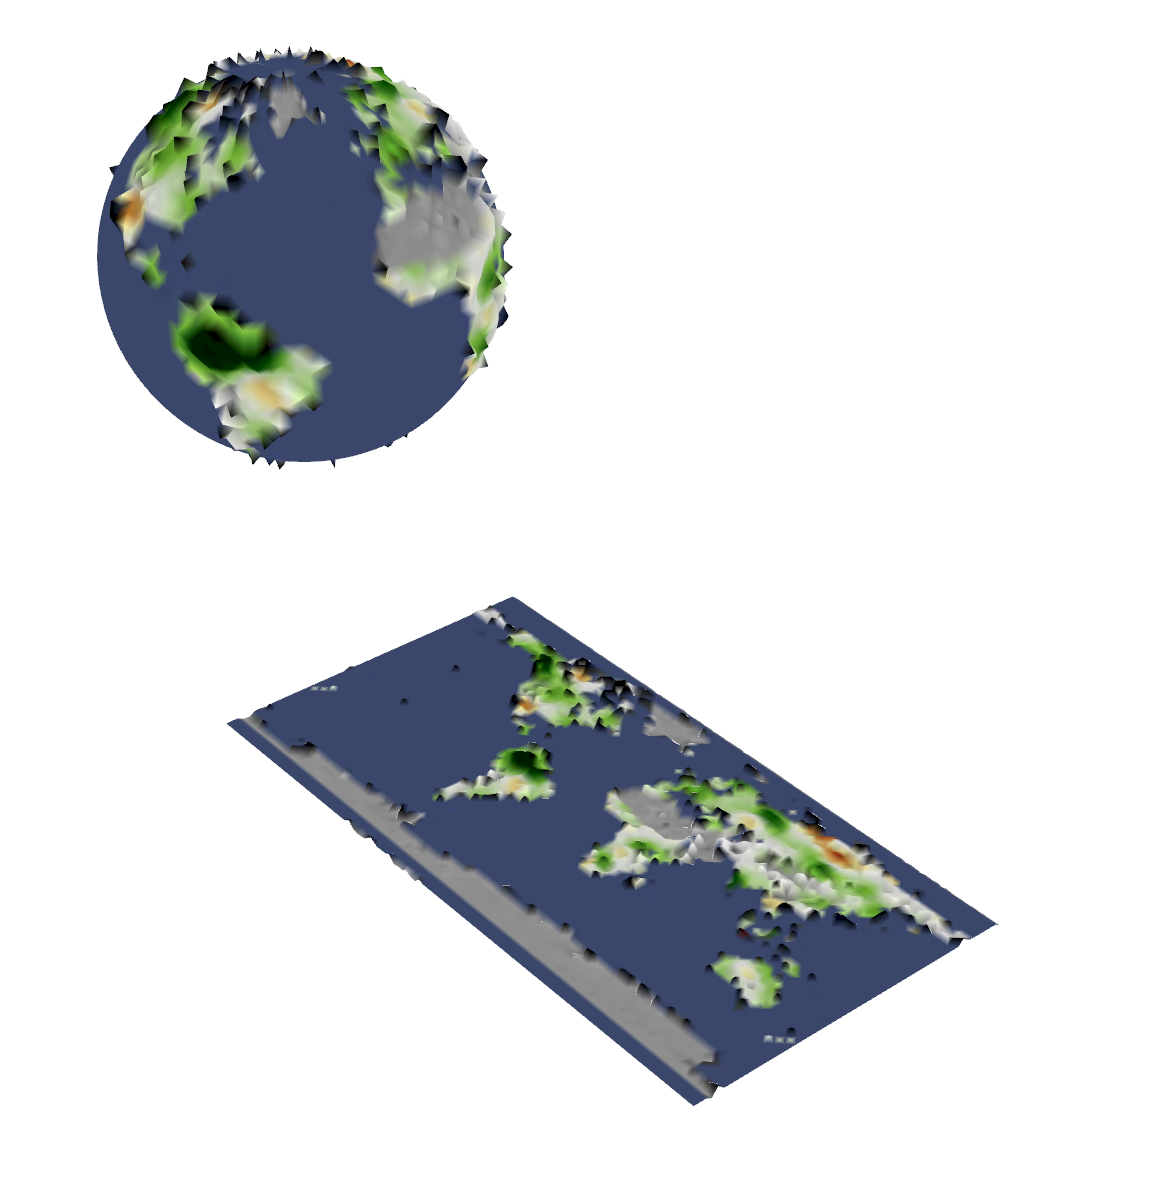
Vegetation
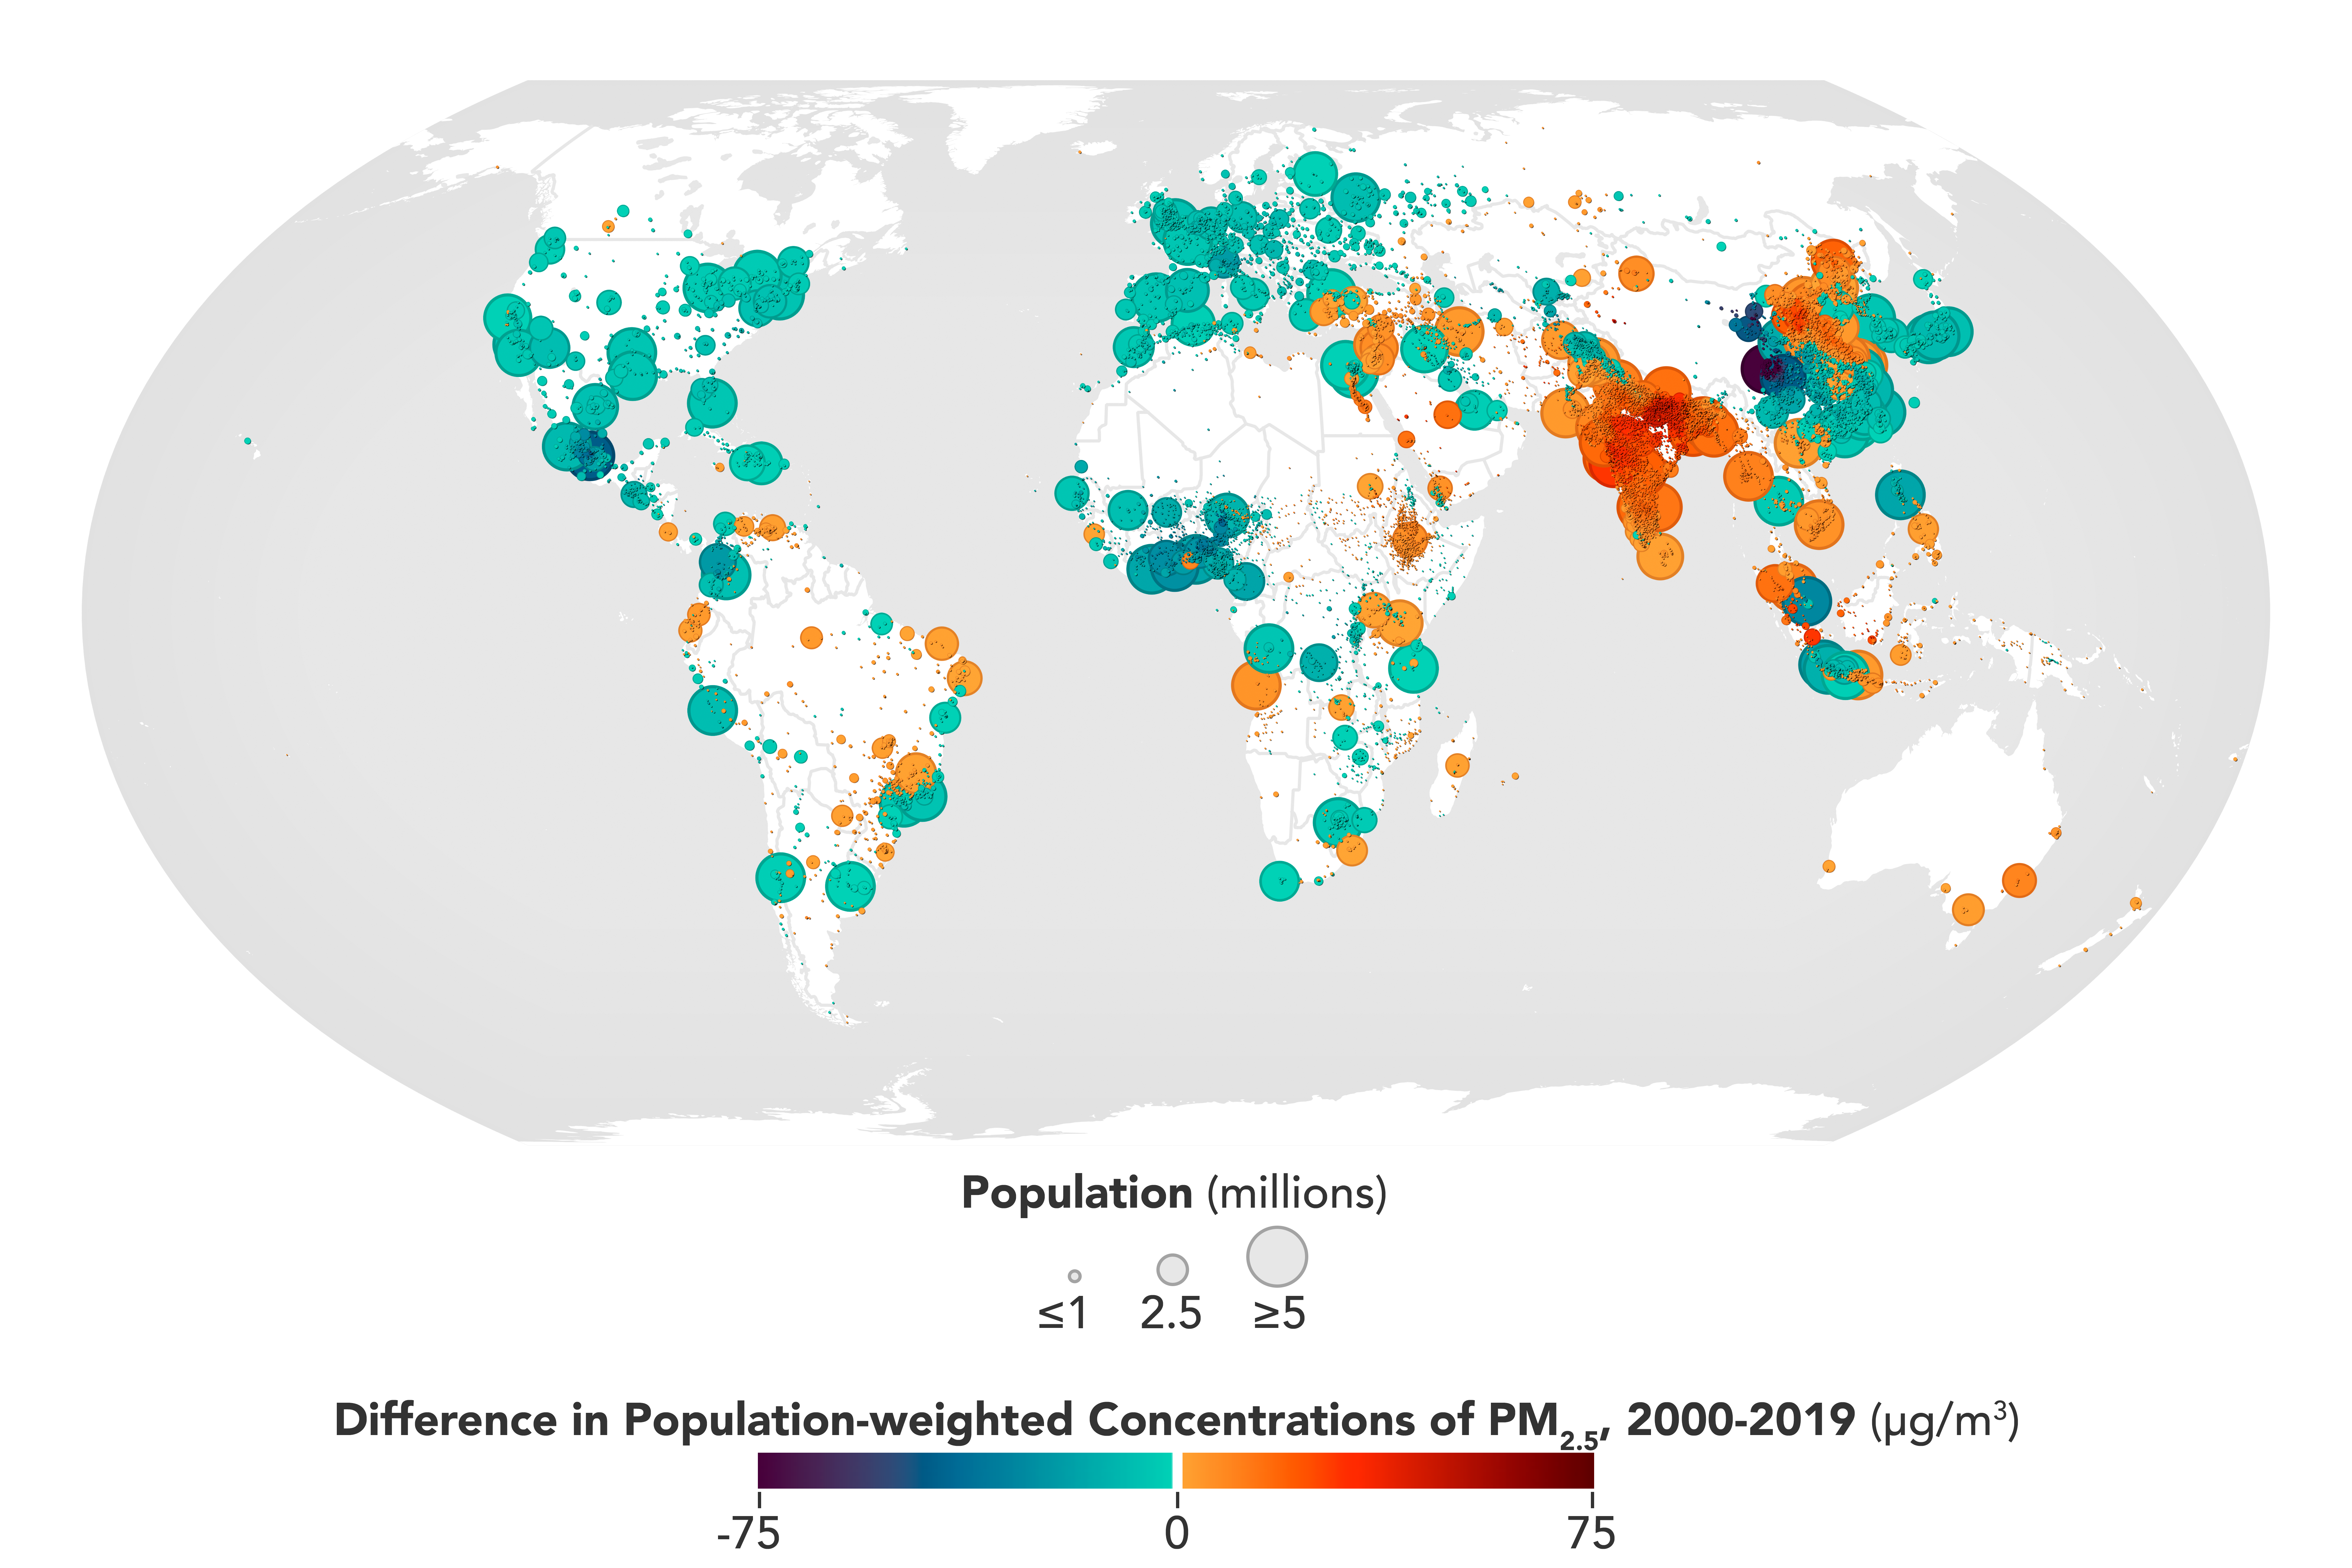
Air Quality
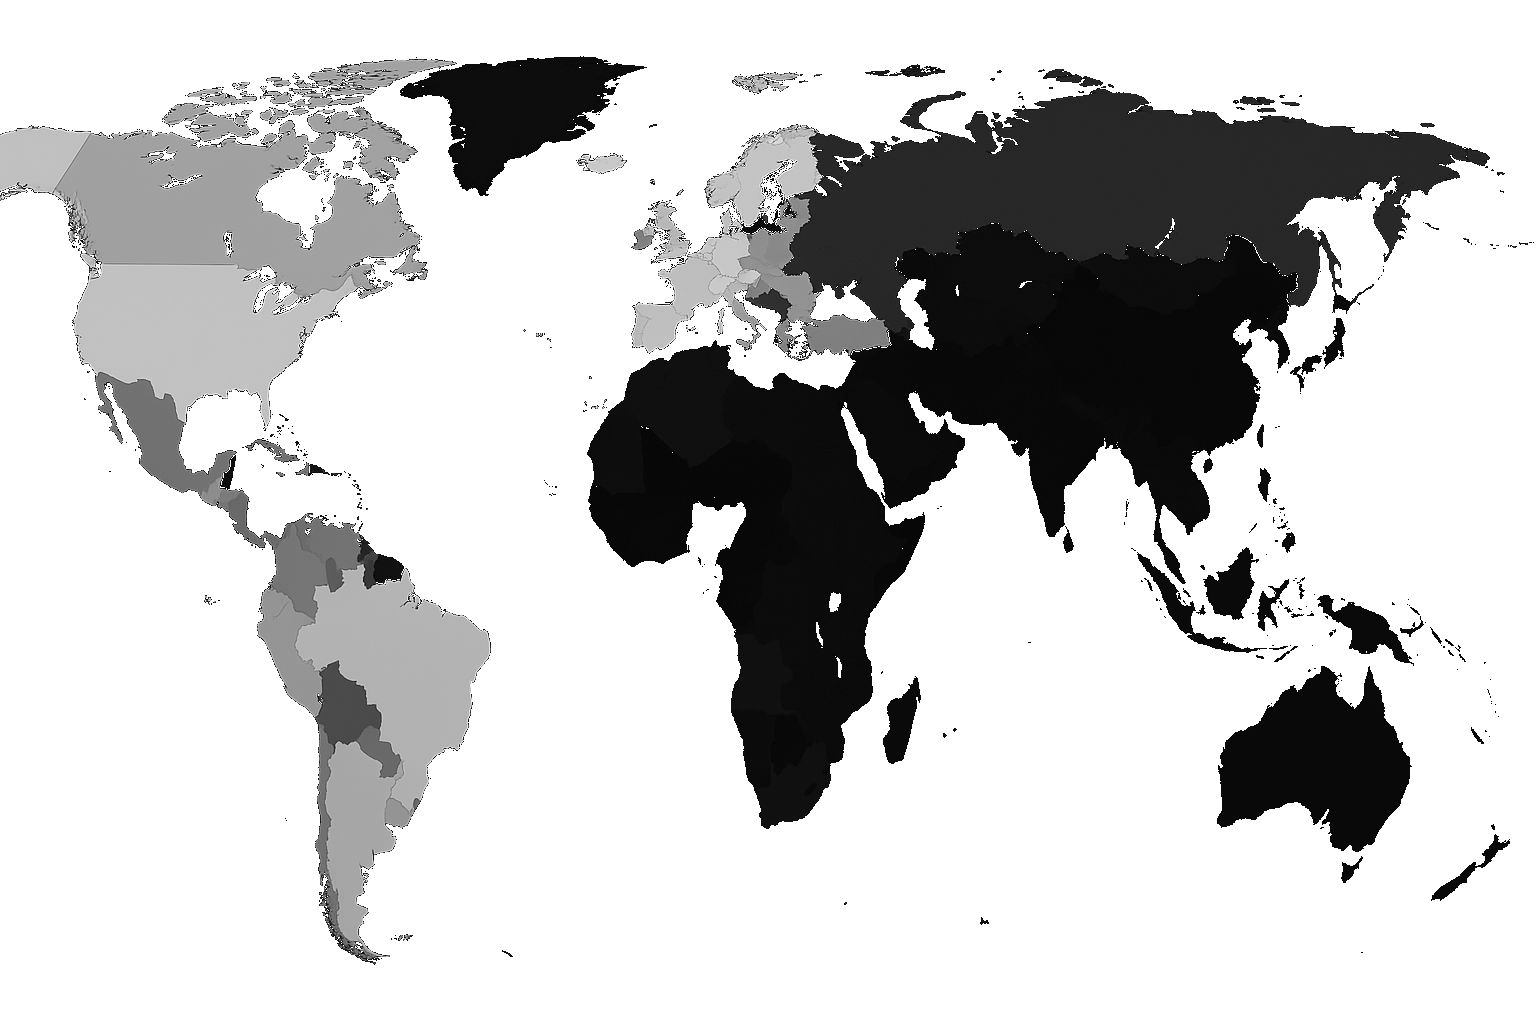
Colonial History
Data workflow
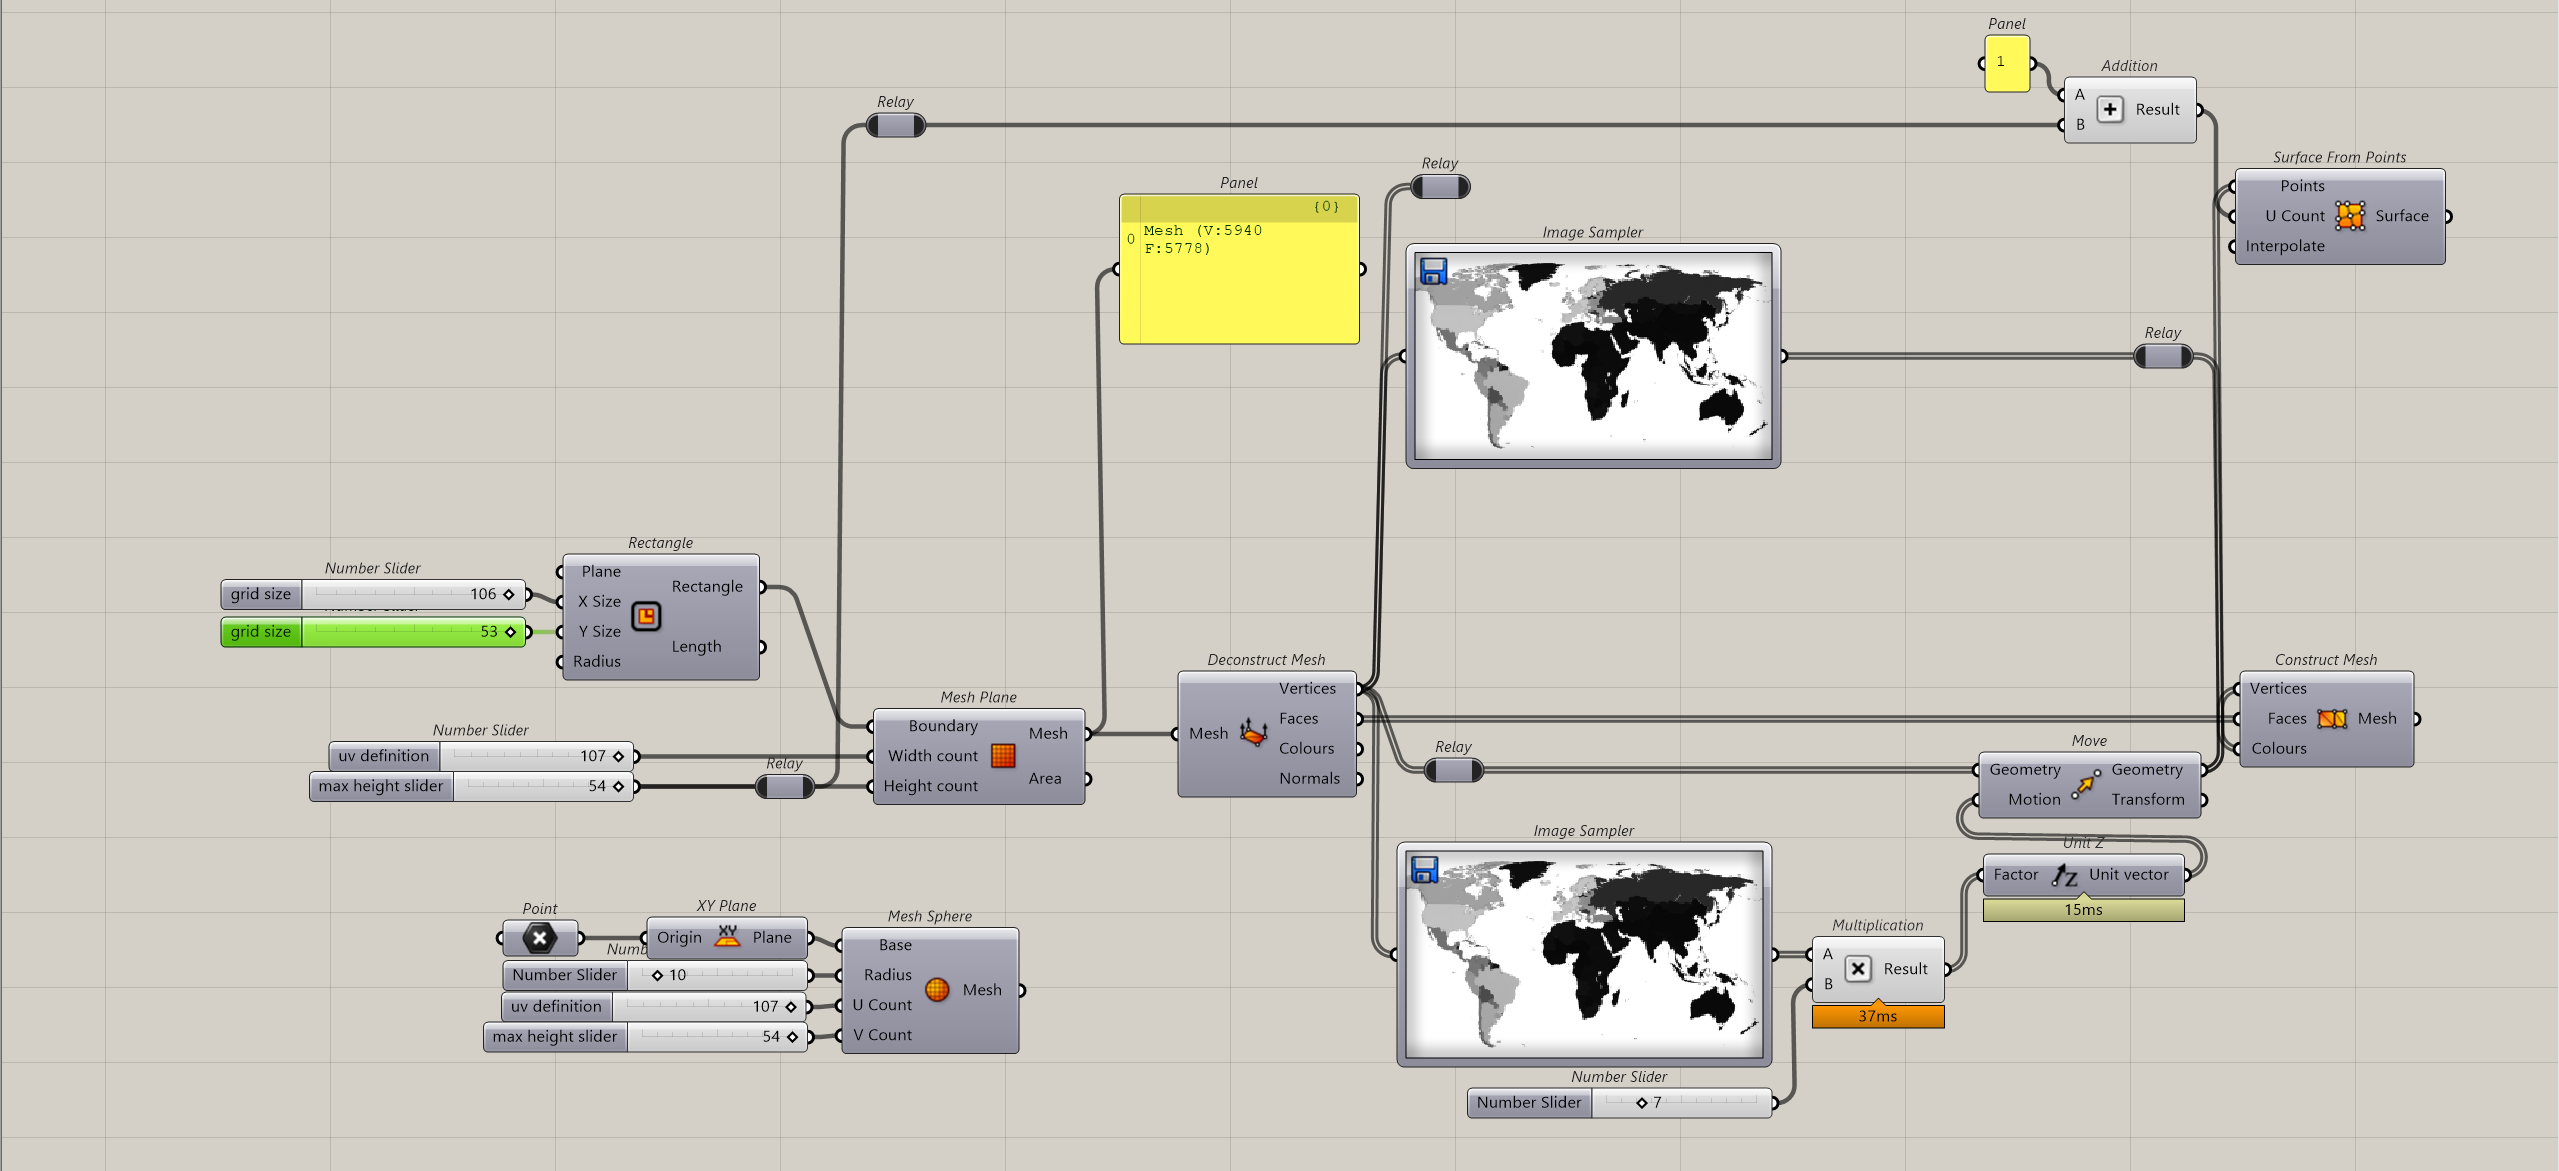
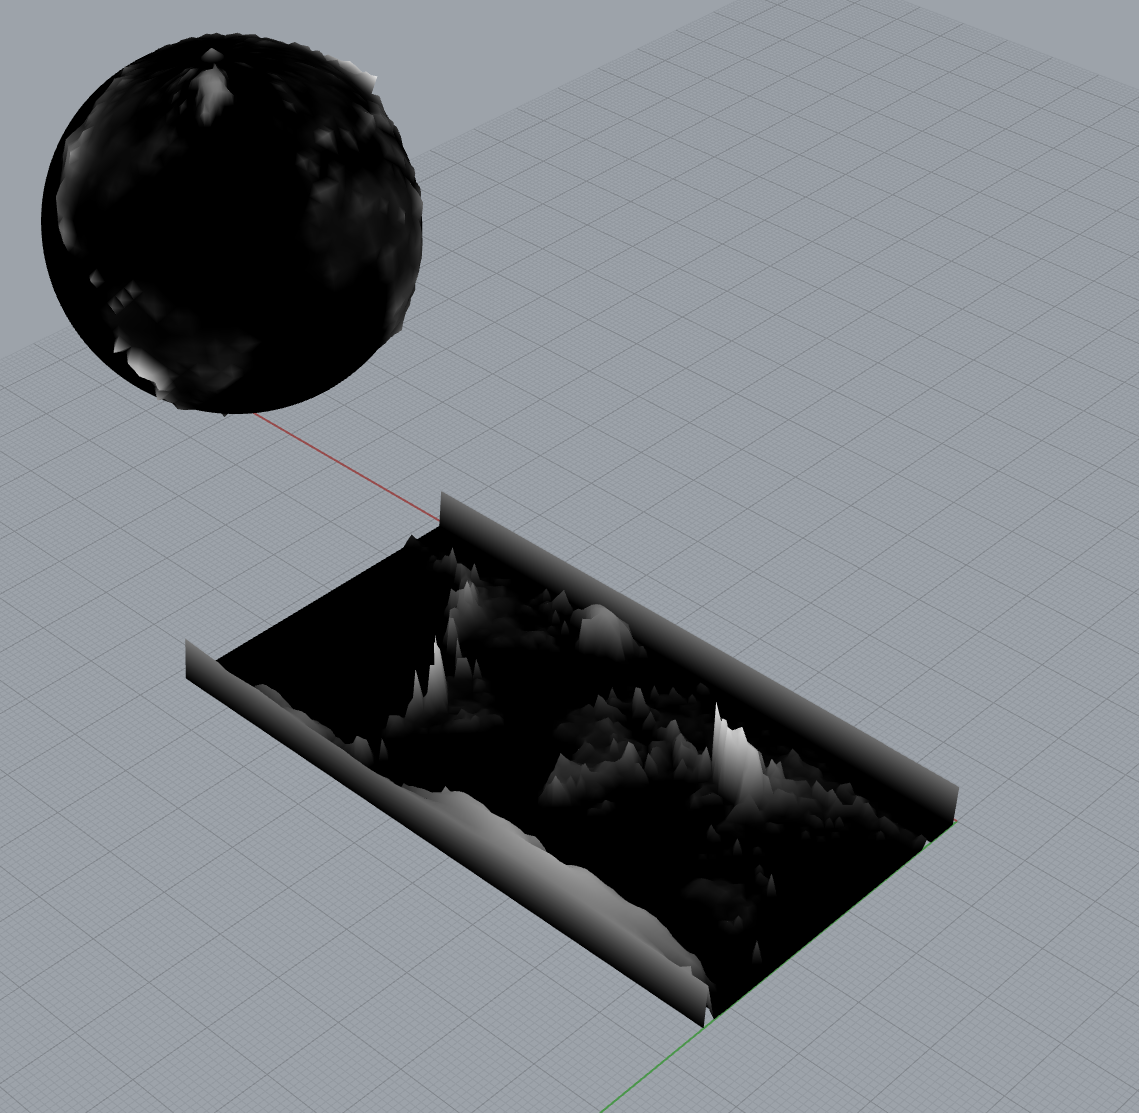
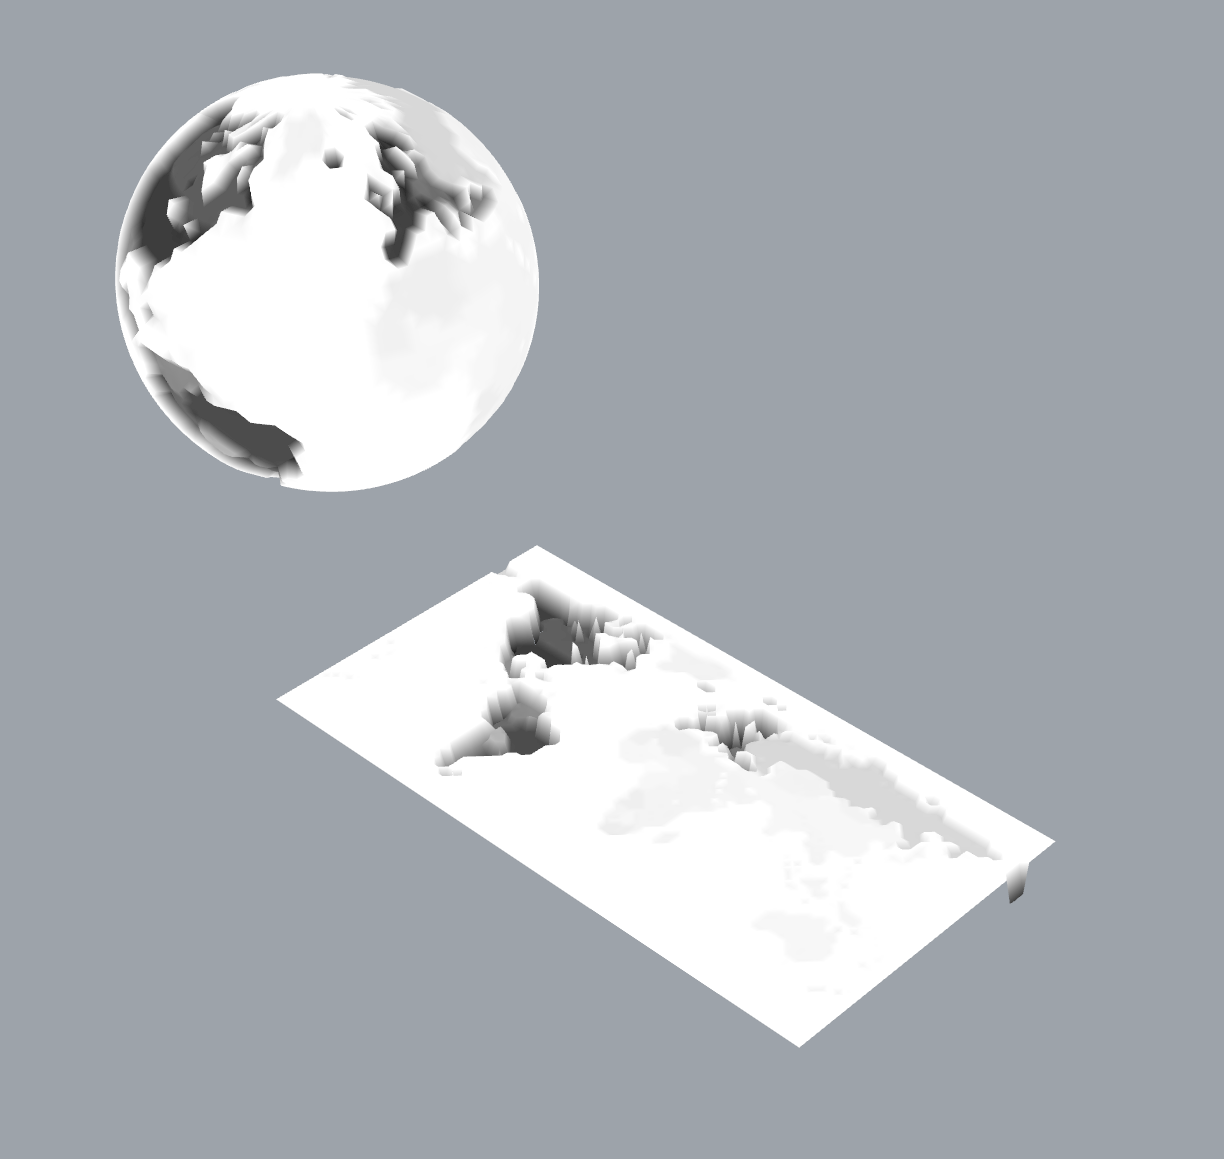
Creating height maps from image data using image sampling techniques
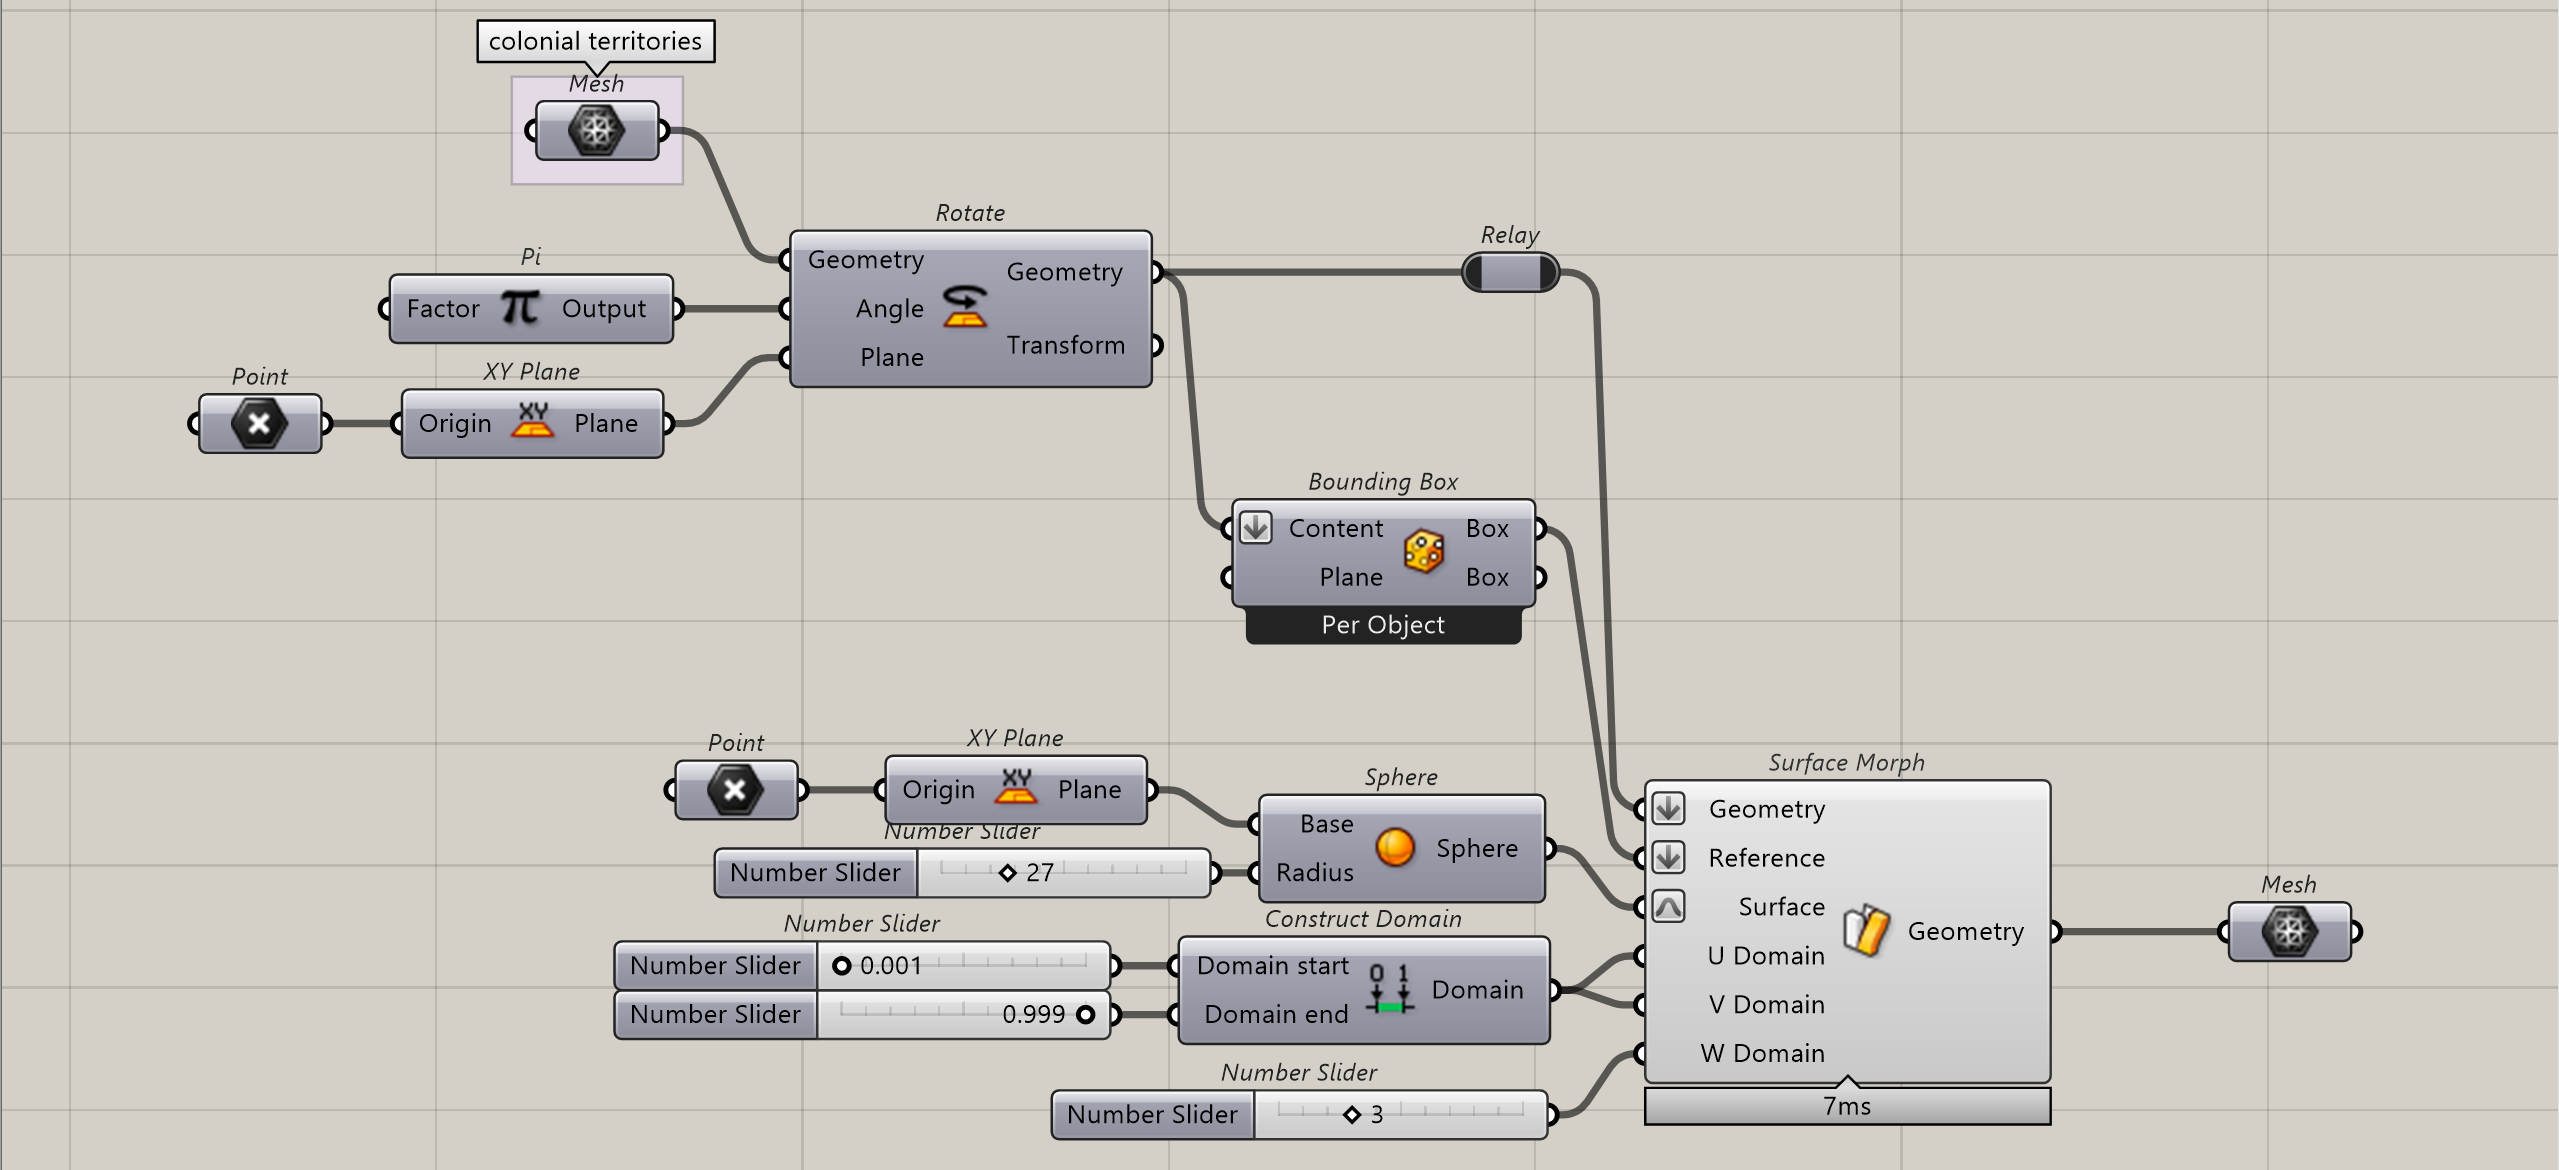
Transforming flat earth meshes into spherical models with voxel representation
DATASETS
Reference Materials
The Colonial Impact Project utilizes the following datasets:
These datasets form the foundation of our Colonial Impact visualization, allowing users to explore the historical legacy of colonization in a tangible, three-dimensional format. By transforming these data points into physical relief on our 3D globes, we make visible the often overlooked patterns of colonial influence across the world.